High-Level Overview
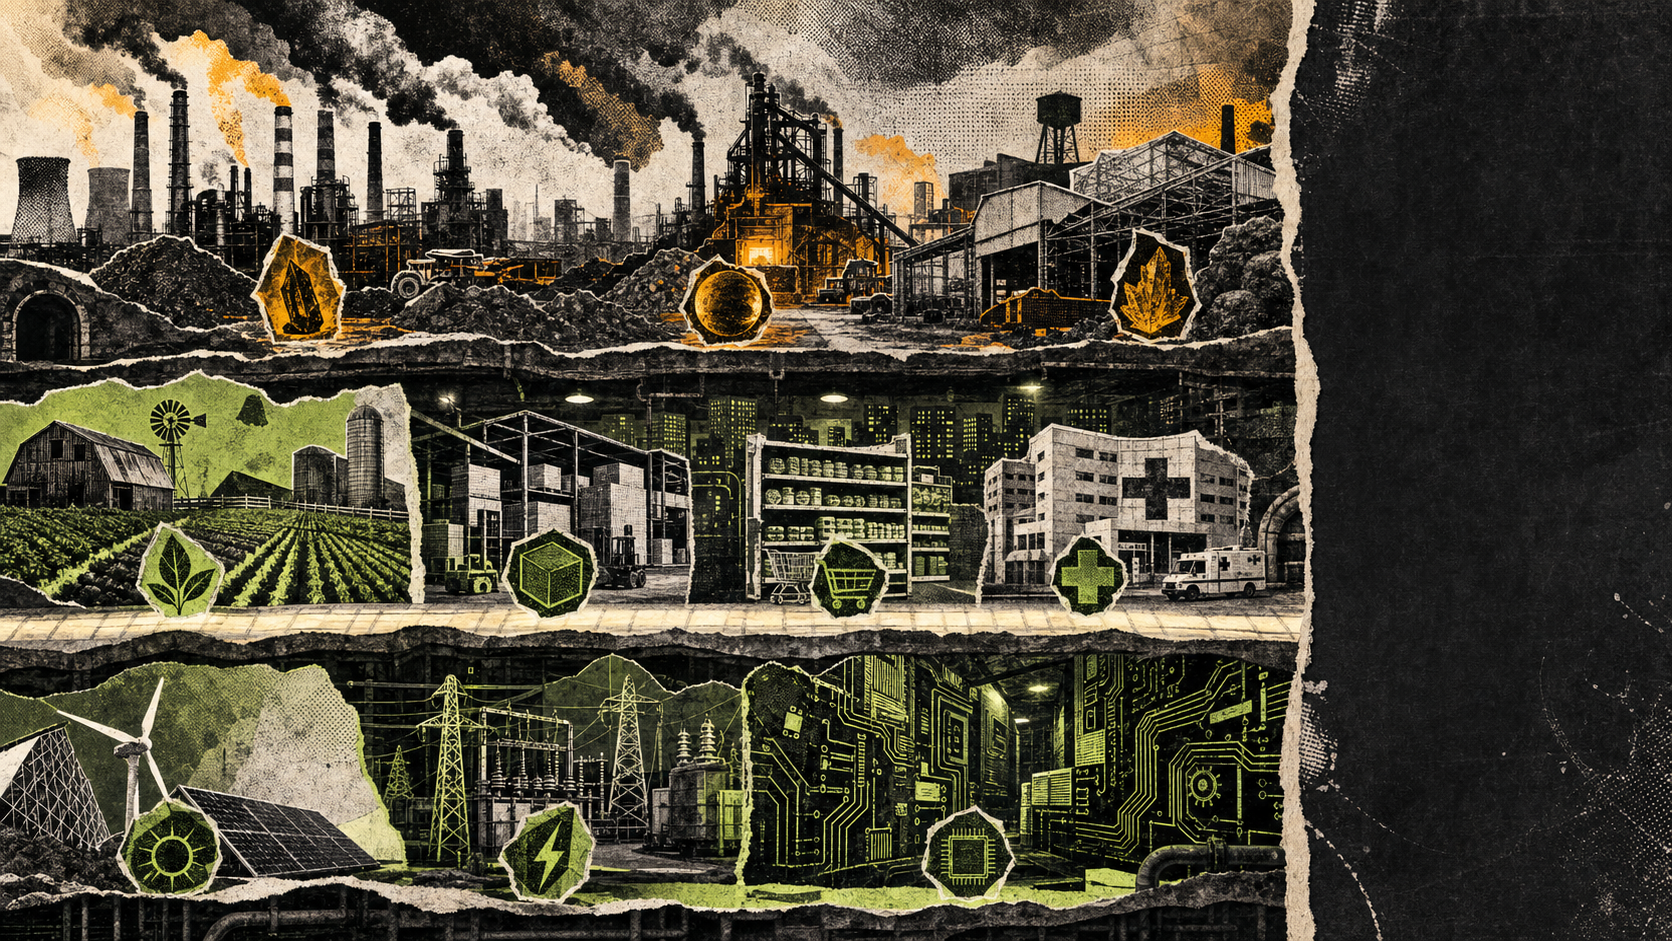
Emission Factors Zine is a static GameLab prototype about comparing supply-chain carbon intensity without pretending the dataset is a climate model. It loads EPA CO2e factors by NAICS, ranks sectors by emissions per dollar, and asks the visitor to collect contrasting sector clues before building a short field guide.
The zine frame is intentional. The dataset is technical, but the interaction is a simple evidence walk: start with a folder of sector clues, collect high and low intensity examples, then turn the comparison into something explainable.
What the Prototype Lets You Do
- Open a static browser app backed by
epa_supply_chain_ghg_emission_factors_co2e.csv. - Compare NAICS sectors by kg CO2e per 2022 U.S. dollar of purchaser price.
- Collect high and low sector stickers to reveal contrast in supply-chain factors.
- Move through intro, tutorial, cutscene, settings, credits, and Field Guide states without a backend.
- Inspect the local EPA source note before treating any factor as evidence.
Source Backbone
The local source note captures the exact compact CO2e CSV used by the prototype and the caveat that these are factors, not total emissions.
epa_supply_chain_ghg_emission_factors_co2e.csv, retrieved 2026-07-01, 123,481 bytes, with 1,016 data rows and 8 columns.
6025a14c4fe16675735efba1683030e4d36011e3973f3c4261f8231aa69c002f.
- Source note: epa_supply_chain_ghg_emission_factors_co2e.md
- Local CSV: epa_supply_chain_ghg_emission_factors_co2e.csv
- Catalog page: https://catalog.data.gov/dataset/supply-chain-greenhouse-gas-emission-factors-v1-3-by-naics-6
- Direct download used: https://pasteur.epa.gov/uploads/10.23719/1531143/SupplyChainGHGEmissionFactors_v1.3.0_NAICS_CO2e_USD2022.csv
Build Detail
The playable app ships as static HTML, CSS, JavaScript modules, local Three.js, generated zine art, courier sprites, cutscene panels, and the EPA CSV in data/. The app parses the source rows client-side, ranks factor values with margins, groups sectors by NAICS prefix, and leaves the source file unmodified.
Related builds
Micromobility Riot Map uses another public dataset as a zine-like browser artifact. Transporter TSI Riot turns transportation indexes into signal lanes. Motor Fuel Underground turns fuel-tax rates into an arcade dashboard.