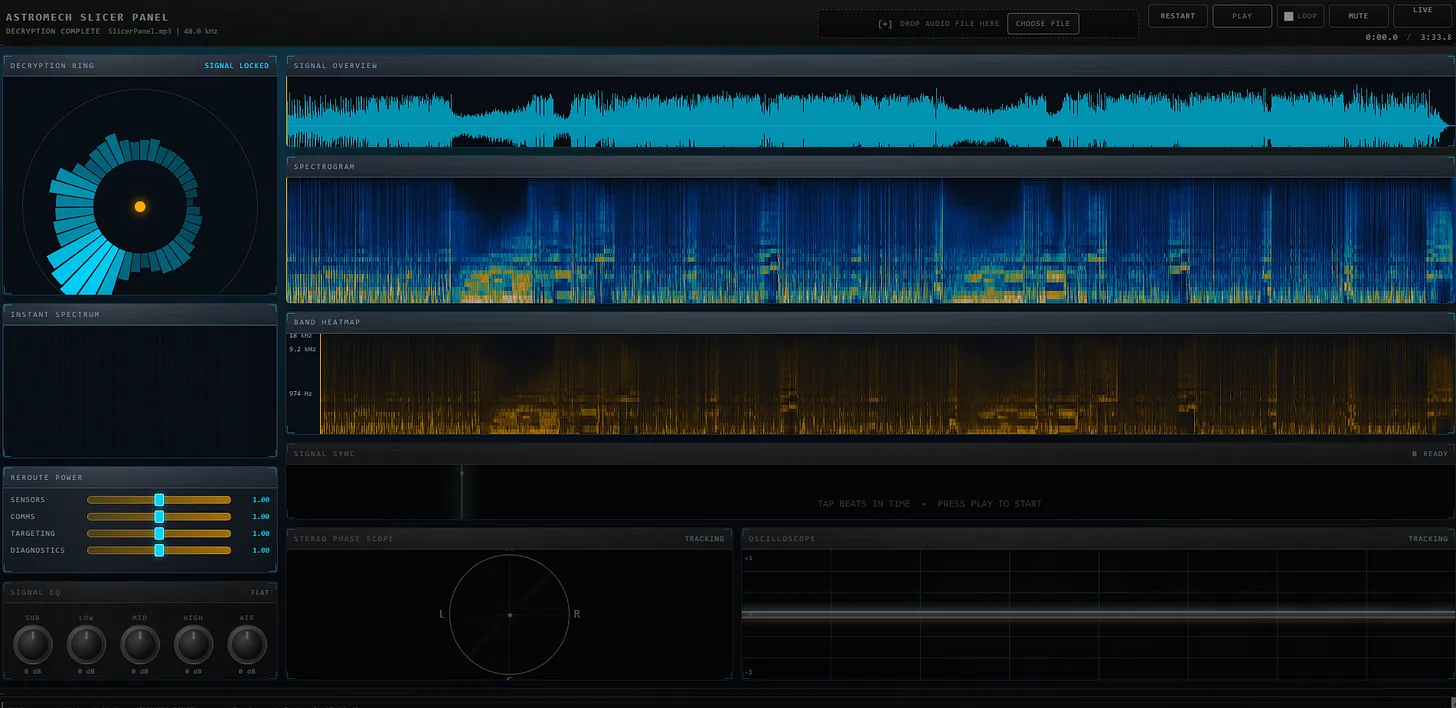
The Splicer Panel interface: decryption ring, signal overview, spectrogram, band heatmap, and signal EQ controls
The Story: From Margarita to Multi-Agent Workflow
This submission started with the world's largest margarita on a Saturday afternoon. Eric had been watching Kyle's Audio FFT Visualizer submission—a stunning recreation of an $8,500 hardware spectrum analyzer. The brushed metal texture reminded him of Star Wars astromech droid interfaces, and he wondered: could I build a splicer panel interface?
"I didn't quite get there [to the astromech droid interface], but I did get to a very interesting place."
What emerged wasn't just a visualizer—it was a proof of concept for multi-agent AI workflows. Eric built a planning-to-execution pipeline that used three different AI tools in sequence:
- ChatGPT for initial concept and planning prompts
- Claude (via GitHub Copilot) for detailed architecture and code planning
- Codex for implementation across 13 markdown specification files
The "Margarita Constraint"
Eric imposed a strict constraint: no React, no build tools, no server-side code. Everything runs in the browser as raw HTML, CSS, and JavaScript. This was inspired by Colin's observation in his submission about how much audio processing capability now exists natively in browsers—features that would have required server-side processing just a few years ago.
💡 Key Insight
Modern browsers can handle FFT analysis, spectrograms, and real-time audio visualization entirely client-side. What used to require specialized libraries or server processing now works with pure JavaScript and the Web Audio API.
Features
The Splicer Panel includes:
- Signal Overview: Real-time waveform display
- Spectrogram: Frequency visualization over time
- Band Heatmap: Color-coded frequency bands
- Decryption Ring: Circular animated visualization
- Stereo Phase Scope: L/R channel correlation display
- Signal EQ: Clickable dials with mechanical latch sounds
- Live Mode: Curtain-reveal theater animation with beat mapping
The Multi-Agent Workflow
Eric's innovation wasn't just the app—it was the process. Here's how it worked:
Phase 1: Planning with Claude
Using GitHub Copilot's planning feature, Eric and Claude generated 13 detailed markdown files
covering architecture, audio pipeline, state management, and each UI component. These lived in
a plans/ directory that served as the specification.
Phase 2: The 626-Line Codex Prompt
Eric then asked Claude to write a prompt for Codex—a 626-line engineering specification that instructed Codex to work through all 13 plan files and implement the entire application. He clicked "go" and went to bed.
"I clicked the go button and then I went to bed... When I came up this morning, there was one bug I had to fix."
Phase 3: Polish with Natural Language
The curtain reveal animation in Live Mode? Created with a single sentence: "I'd like the live mode to start with a curtains reveal like a theater." Claude generated the component, and it just worked.
What This Proves
In the old world, Eric would have spent a weekend at Half Price Books buying physics and acoustics textbooks, then mapped equations to functions by hand. In this new world:
"I went and had some cheesesteak burritos, really great margaritas... and then yeah, the next day, this was largely done."
The Splicer Panel demonstrates that orchestration beats implementation. The skill shifts from writing code to designing workflows, from syntax to architecture, from execution to direction.
Video Walkthrough
🔗 Related Links
- Try it yourself: Live Demo
- Live Club Mode: Full-Screen Experience
- Source Code: GitHub Repository
- Original Article: Advisory Hour Substack
- Inspired by: Kyle's Audio FFT Visualizer
🏆 Competition Status
This is Eric's second Week 1 submission. He's demonstrating that multi-agent workflows aren't just faster—they produce production-ready code that would have taken weeks by hand.