Source note: Local copy of a Summer Into AI 2026 submission originally published on Substack. Screenshots, video, and audio found in the post body are mirrored locally when publicly accessible; profile and avatar images are intentionally not copied. Read the canonical post.
There’s a particular kind of rebellion in taking government data that was technically “made public” and actually making it public.
Not public in the legal sense. Public in the human sense.
That’s the lane I tried to stay in with Disaster Graffiti Lite, a one-page React app built from FEMA disaster declaration data published through data.gov. The source material is exactly the sort of thing that satisfies the letter of transparency while often failing the spirit of it: rows, fields, dates, codes, declarations, incident types. Useful, yes. Legible, not really. The data exists. The understanding does not.
That gap is where this week’s theme, “Data Punk,” gets interesting.
Data Punk is not just a style choice
It would be easy to read “punk” and stop at the visual layer. Make it loud. Make it rough. Throw some neon on a dark background. Use jagged borders and aggressive typography. I did all of that, happily.
But the real punk move is not the color palette. It’s the refusal to leave important information trapped in bureaucratic form.
Data Punk, at least the way I read this week’s theme, is about taking institutional artifacts and dragging them back into public life. It’s about looking at some federal dataset that was uploaded because it had to be uploaded, and deciding that “available” is not the same thing as “usable.” It’s about building the missing layer between raw disclosure and public comprehension.
That’s why data.gov matters here. The site is full of material with civic value and near-zero narrative value. It contains the bones of stories that most people will never read because the format is indifferent to them. If you want to do something useful, that indifference is your opportunity.
Why FEMA disaster declarations
I used the FEMA Disaster Declarations Summary dataset from data.gov and built a curated local sample covering recent years of hurricanes, floods, fires, tornadoes, and winter storms. I wanted a dataset with immediate stakes. Disaster data has no trouble answering the question, “Why should anyone care?”
People care because these are not abstract events. They map directly to damaged homes, disrupted towns, insurance fights, emergency response, and the widening footprint of climate-driven risk.
But even with that urgency, the raw dataset still needs interpretation. A CSV or JSON dump does not tell a story on its own. It does not tell you what patterns stand out. It does not help you quickly compare states. It does not translate frequency into meaning. It does not give you any emotional entry point at all.
So the app does a few simple things on purpose:
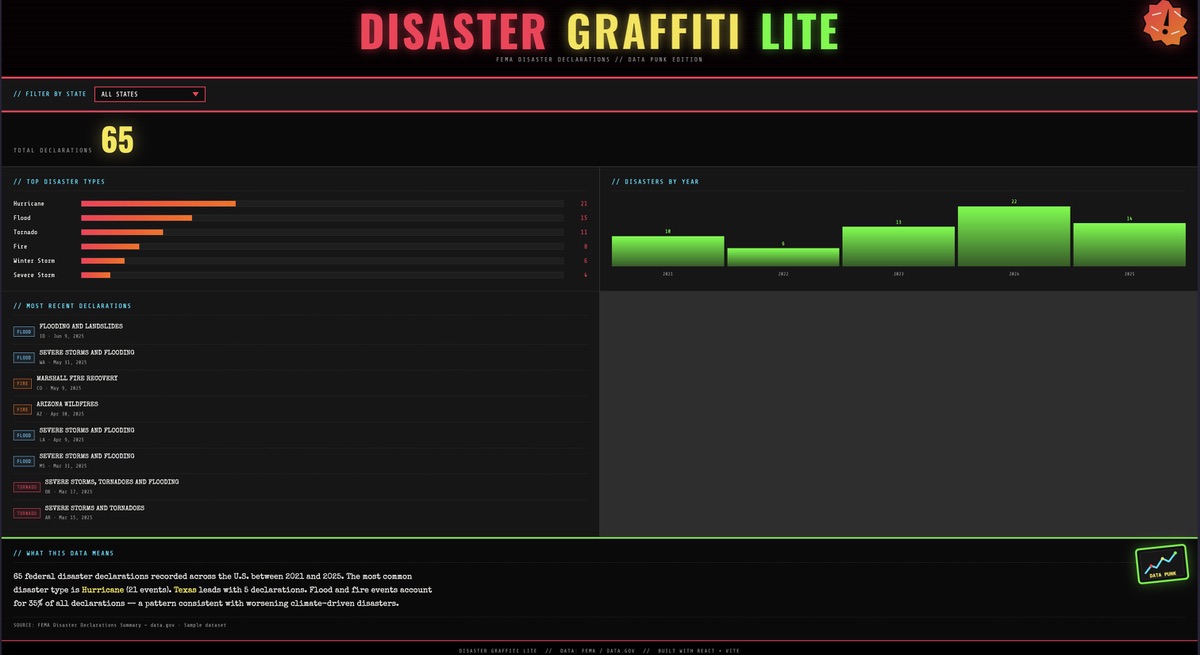
It lets you filter declarations by state. It shows a live total. It ranks the top disaster types. It visualizes declarations by year. It surfaces the most recent events. And it generates a plain-language “what this data means” summary from the selected slice.
None of that is especially complicated from a software perspective. That’s part of the point.
Civic usefulness does not always require technical grandiosity. Sometimes it requires restraint: pick a public dataset, reduce friction, expose pattern, stop when it’s understandable.
The design had to reject dashboard professionalism
The app is called Disaster Graffiti Lite because I didn’t want it to feel like a municipal procurement portal or a corporate analytics product pretending concern through tasteful gradients.
I wanted it to look a little disobedient.
So the interface leans into a punk-zine aesthetic: black background, neon pink, yellow, green, and cyan accents, big poster-like headings, monospaced labels, rough borders, sticker elements, scanline texture. Even the charts reject the polished library look. They’re built directly in CSS, which keeps them raw and slightly handmade.
That visual choice is not cosmetic in the trivial sense. It’s argument by design.
If the dataset comes from an official pipeline, the interface does not have to inherit the emotional deadness of that pipeline. A public-interest app can be loud. It can have attitude. It can signal that the user is not entering a records room; they are entering an interpretation.
That, to me, is part of the “punk” in Data Punk. Not nihilism. Not mess for the sake of mess. A refusal to present meaningful public information as if it belongs only to experts, analysts, or agencies.
This project fits the theme because it turns compliance into utility
The more I think about this week’s framing, the more I think the best Data Punk projects are doing one simple thing: converting compliance artifacts into public tools.
A lot of public data feels like that. It exists because someone had to publish it. That’s better than secrecy, but it’s not the same as service. Data becomes civic infrastructure only when somebody builds the missing interface around it.
That’s the move here.
FEMA already has the declarations. Data.gov already exposes them. But Disaster Graffiti Lite asks a different question: what would this look like if it were built for curiosity instead of recordkeeping?
What if someone could open a page and immediately see that one state is getting hammered by hurricanes, another is stacking flood declarations, and a given year spikes in a way that feels hard to ignore? What if a student, journalist, community member, or local official could get a first read in seconds instead of spelunking through raw files?
That is a small act, but it’s a real one. It takes data from inert to conversational.
What I like about building from data.gov
Using data.gov for a challenge like this forces a useful discipline. You don’t begin with a product fantasy and then invent fake data to support it. You begin with reality in all its awkwardness, inconsistency, and administrative blandness, and then you ask: what deserves to be seen here?
That changes the posture of the build.
You become less of a stylist and more of a translator.
You start looking for the hidden human story inside field names and timestamps. You start thinking about interpretation as a form of public service. You realize that one of the most practical things AI-era builders can do is not just generate more content, but reveal the value in material that already exists and is being ignored.
There is something refreshingly unglamorous about that. And also, if I’m honest, something mischievous.
Because there’s a quiet satisfaction in taking data that was likely uploaded with zero expectation that anyone would make it vivid, and then making it vivid anyway.
The broader point
I think that’s why “Data Punk” works as a theme. It pulls in two instincts that usually sit apart.
The first is civic utility: make something that helps people understand the world they live in.
The second is creative rebellion: do not accept the default formats, tones, or interfaces handed to you by institutions.
Put those together and you get something better than a dashboard and more useful than pure aesthetic experimentation. You get an artifact that says public data should feel public. You get software that doesn’t just visualize information, but reclaims it.
That’s what I wanted Disaster Graffiti Lite to be.
Not a giant platform. Not a polished enterprise product. Just a loud, readable, one-page argument that federal data can be turned into something immediate, interpretable, and alive.
If that’s not Data Punk, I don’t know what is.
github: https://github.com/MegaSF/SummerAiWeek3
Original source
Canonical Substack URL: https://evanrhea.substack.com/p/disaster-graffiti-lite-and-the-case.